See What Your Business Is Really Doing
Most businesses run on a mix of gut feel and scattered numbers in systems that do not talk to each other. Data intelligence brings it all into one clear, honest picture, so your team decides on reality, not assumptions. We build business intelligence, customer insights, data visualisation and decision support.
Start Your Project- Senior engineer replies within 24 hours
- NDA on request
- No obligation
Describe your project
Share a few details and our team will reach out to you within 24 hours.
From Scattered Numbers to a Clear Picture
Engineering discipline over hype — that is the thread through every kind of AI development we do.
Most businesses collect far more data than they actively use. Sales records, customer interactions, support tickets and operational data often sit across multiple systems, making it difficult to see what is really driving performance. The information exists, but the insight remains hidden.
Data intelligence brings that information together into a clear, reliable view of the business, and sits alongside the rest of our AI data & intelligence work. While machine learning focuses on prediction, data intelligence focuses on visibility, helping you understand what is happening today, where opportunities exist and where resources are being lost. Better decisions start with a clearer picture.
This work spans business intelligence, customer insights, data visualisation and decision support systems. Together, they transform disconnected data into practical information that leaders can act on with confidence. The foundation of all of it is data quality, because even the best analytics become unreliable when the underlying data is inconsistent or incomplete. That is why we focus first on getting the data right, so every insight is built on something trustworthy.
The Intelligence Work We Build
Effective decisions depend on accurate information. We build business intelligence solutions that unify data across systems, create a single source of truth and deliver the visibility leaders need to operate with confidence.
Business Intelligence
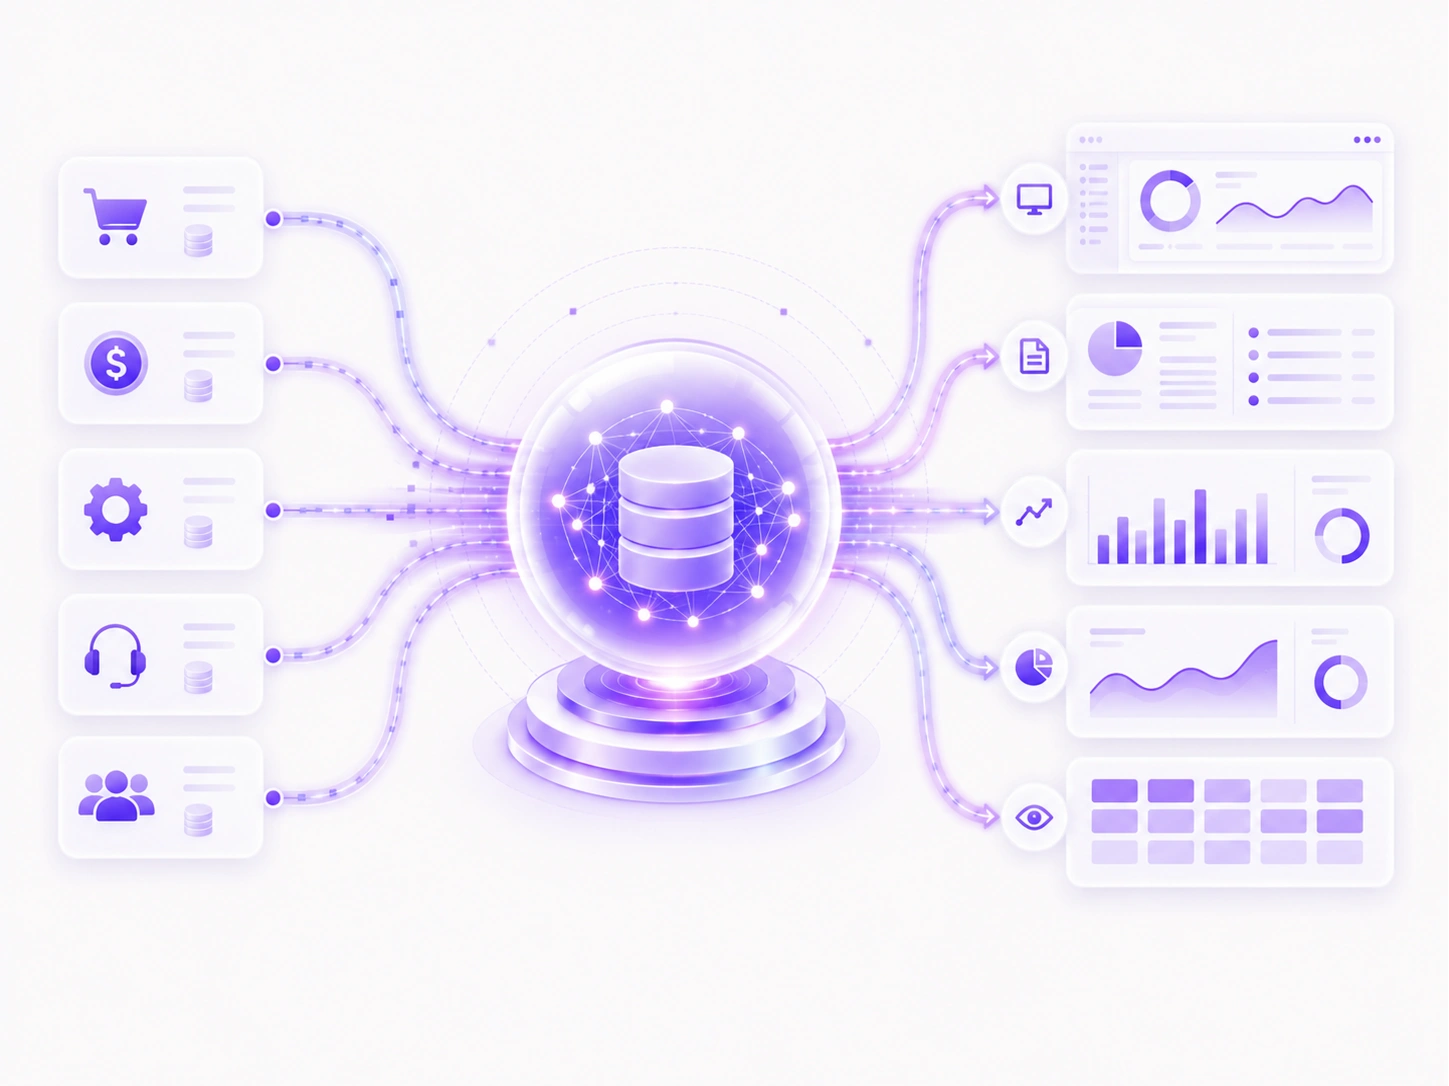
Business intelligence brings the data from across your systems together and turns it into clear, reliable reporting, so you can see how the business is performing without manually pulling numbers from five places and stitching them into a spreadsheet every week. Instead of a fragmented, out-of-date view, you get one source of truth that everyone can trust and that updates itself.
We build BI that connects to your real systems, sales, finance, operations, support, using solid database integration to reconcile the data into a consistent picture, and presents it in dashboards and reports tuned to what your business actually needs to track. The tedious weekly ritual of assembling reports by hand disappears, replaced by live views that are always current. More importantly, because the numbers are reconciled and consistent, people stop arguing about whose figures are right and start discussing what to do about them, which is where the real value of good reporting lies.
- Brings data from all your systems into one source of truth
- Replaces manual weekly reporting with live, current views
- Reconciled, consistent numbers everyone can trust
- Dashboards and reports tuned to what you actually track
Customer Insights
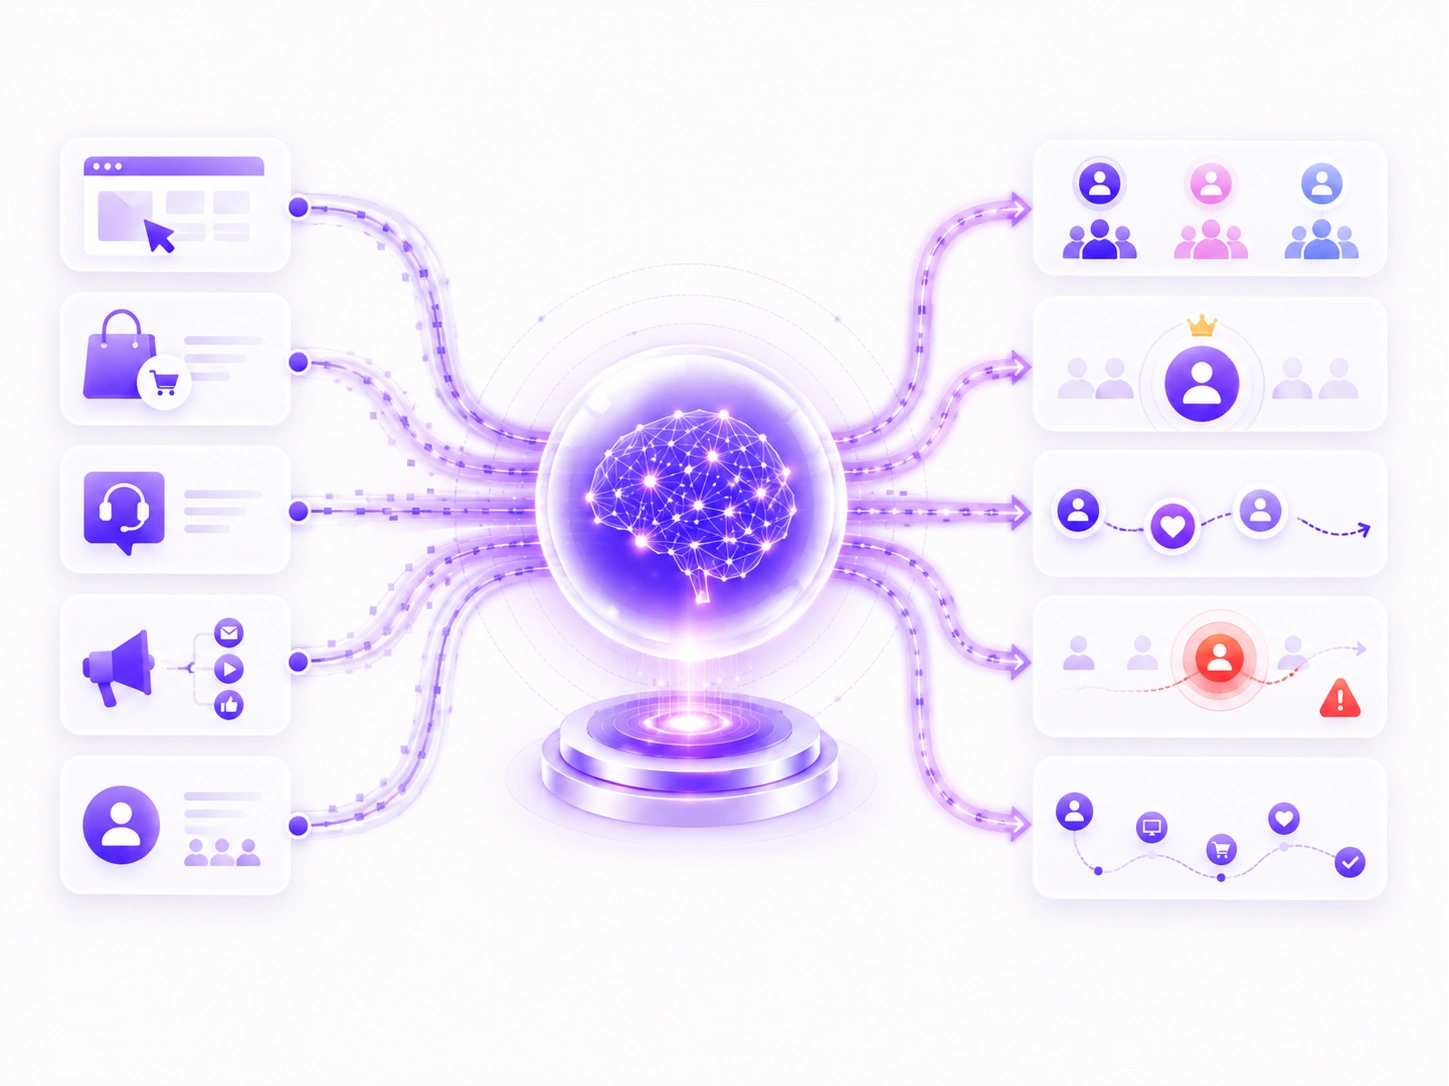
Customer insights reveal who your customers really are, how they behave, which segments are most valuable, where they come from, what keeps them, and why they leave. Most businesses have strong opinions about their customers and surprisingly little hard evidence, and the evidence, when you actually look, often overturns the assumptions everyone was operating on.
We build customer insight by bringing together the data you already hold across sales, behaviour and support, and turning it into a clear understanding of your customer base, segments, value, patterns and lifecycle. This is the difference between believing you know your customers and actually knowing them. It frequently reveals that the customers a business assumed were most valuable are not, that a quiet segment is the profitable one, or that churn has a pattern nobody had spotted. Those discoveries change where you spend marketing money, how you serve different segments, and what you prioritise, often with immediate effect on the bottom line.
- Reveals who your customers really are, with evidence
- Identifies your genuinely most valuable segments
- Surfaces patterns in retention and churn
- Redirects spend and effort to where it actually pays
Data Visualisation
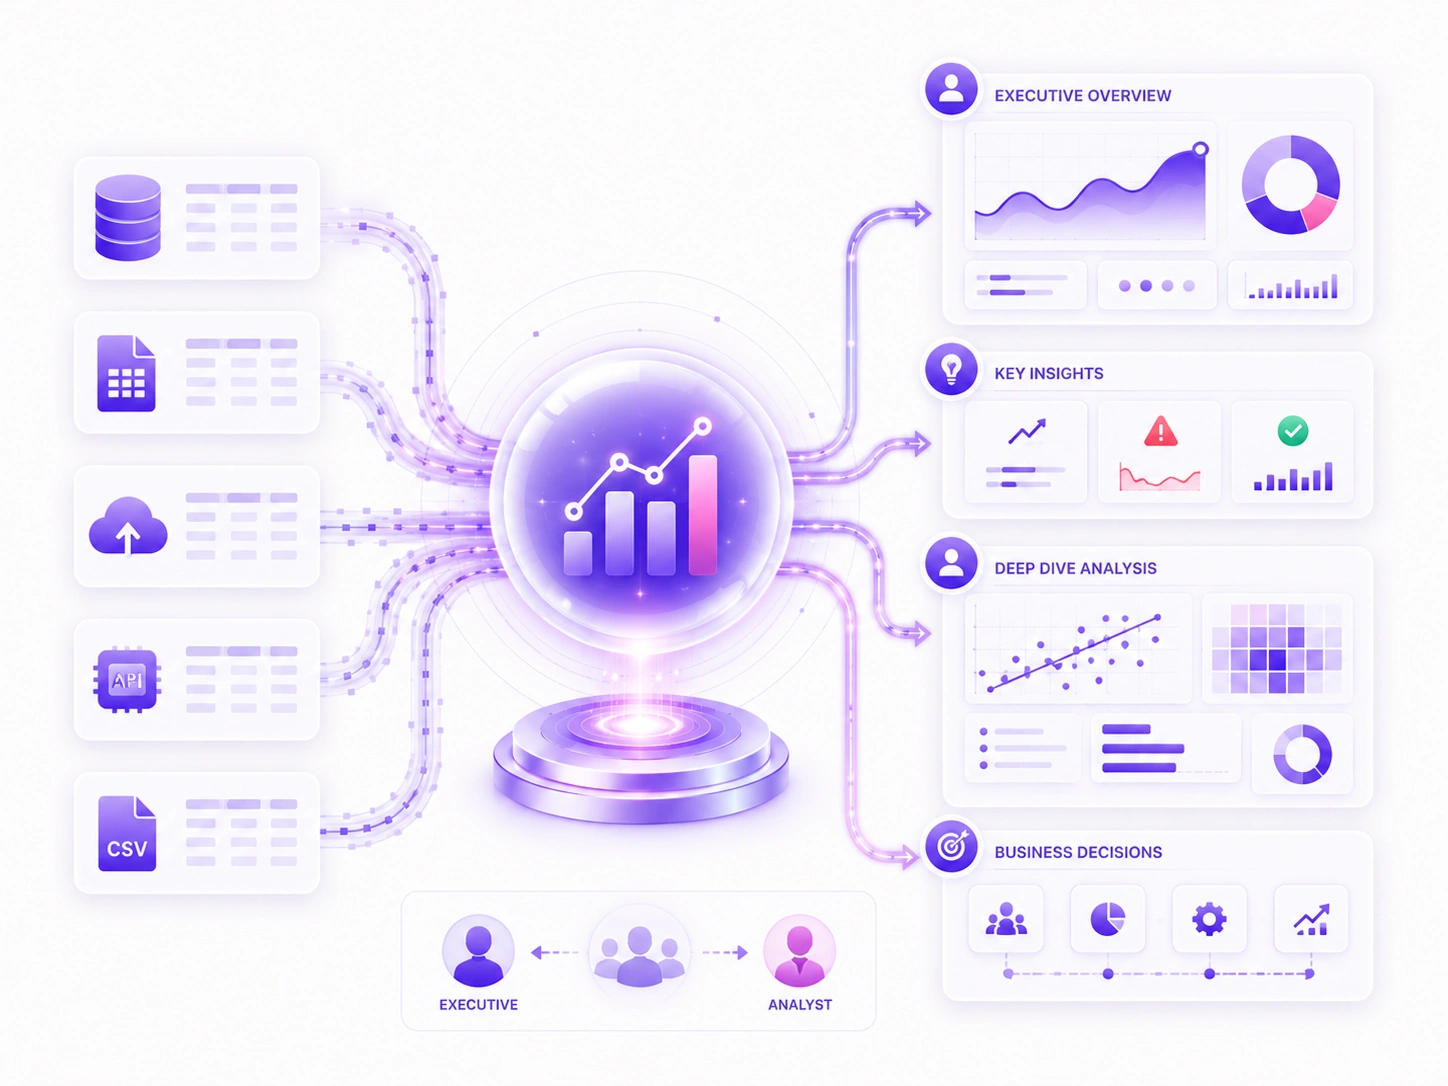
Data visualisation turns numbers into something the human eye can grasp in seconds. A table of figures hides its meaning; a well-made chart reveals it instantly, the trend, the outlier, the relationship that a spreadsheet buries. Good visualisation is not decoration, it is how data becomes understanding, and it is the difference between a report people skim and one that actually changes what they do.
We build clear, honest visualisations and dashboards designed around the decisions they support, not around looking impressive. That means showing the right metric the right way, avoiding the misleading charts that distort more than they reveal, and making the important things obvious at a glance. We design for the people who will actually use them, an executive who needs the headline in five seconds and an analyst who needs to dig in both get what they need. A dashboard that genuinely informs is one people return to daily; one that confuses or misleads is quietly abandoned, and we build for the former.
- Turns numbers into understanding the eye grasps instantly
- Honest charts that reveal rather than distort
- Designed around the decisions they support
- Works for executives and analysts alike
Decision Support Systems
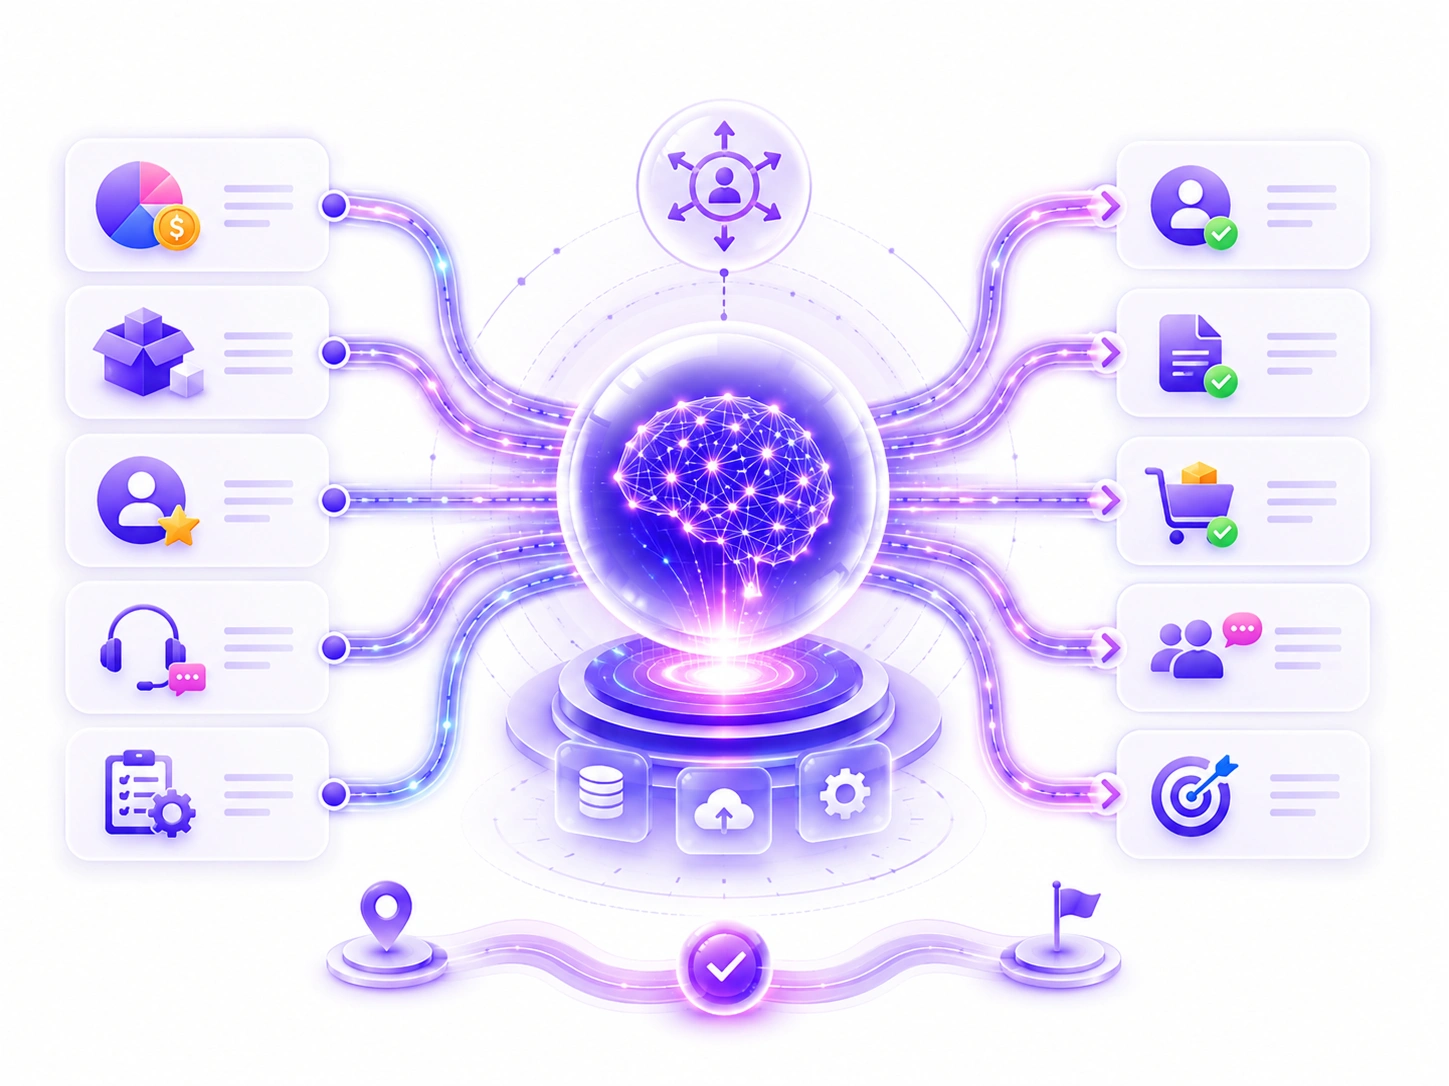
A decision support system puts the right information in front of the right person at the moment they actually make a decision, rather than leaving it buried in a report they might read later. It bridges the gap between having data somewhere and using it when it counts, surfacing what matters for a specific decision, where and when that decision happens.
We build decision support tuned to the real decisions your team makes repeatedly, what to order, which customer to call, where to allocate budget, which case to prioritise, and bring the relevant data and analysis right to that point. Instead of a manager having to know which report to find and how to interpret it, the system presents the relevant picture in context. This turns data from something that sits in dashboards into something that genuinely shapes the choices being made, day to day, by the people making them. It is where intelligence stops being a thing you look at and becomes a thing that changes what you do.
- Right information, right person, right moment
- Tuned to the decisions your team makes repeatedly
- Brings data and analysis into the point of decision
- Turns dashboards into decisions that actually change
The Technology Behind Our Data Intelligence
Data intelligence draws on proven data and analytics tools, chosen to fit your data and the people who will use the result. We are transparent about the stack so nothing is a black box.
We bring your data together into modern data warehouses, with pipelines that keep it current and reconciled, so reporting draws on one consistent, up-to-date source.
We build dashboards and reporting on established BI and analytics platforms, choosing the ones that fit your team's needs and that they will actually adopt.
For visualisation we use proven charting and dashboard tools, designed around clarity and honesty rather than visual flash.
The underlying work runs on Python and SQL, the standards for data work, on cloud infrastructure sized to your data.
Why We Start With Data Quality
The success of any data intelligence project depends on the quality of the data beneath it. We establish a trusted foundation first, so every report, metric and business decision is supported by accurate and consistent information.
The temptation to skip ahead
It is tempting to skip straight to dashboards, and it is the single most common way data projects fail. A beautiful dashboard built on inconsistent, duplicated or out-of-date data is worse than no dashboard, because it gives people confidence in conclusions that are wrong, and confident wrong decisions are more dangerous than admitted uncertainty.
What the foundational work involves
So we start underneath the surface, with the data itself. That means reconciling figures that disagree between systems, removing duplicates, handling the gaps and inconsistencies that every real business dataset contains, and establishing which source is authoritative when two of them conflict. It is unglamorous work and it rarely shows up in the demo, but it is the foundation that decides whether everything built on top of it can be trusted.
Why this shapes the whole project
We are upfront about this because it shapes the project. A data intelligence project that quietly skips data quality looks faster and cheaper right up until the moment someone makes a bad call on bad numbers. We would rather do the foundational work properly and hand you a picture you can actually trust, because the entire point of data intelligence is to replace guesswork with reality, and that only works if the data underneath is real.
Data Intelligence Across Different Businesses
Every industry generates valuable data, but the biggest opportunities appear when information from different systems is connected into one clear view. Here are a few examples of where data intelligence creates measurable business value.
Retail & Ecommerce
Connect sales, inventory, marketing and customer data to understand true profitability, optimise product performance and identify the customers who drive the most long-term value.
Professional Services
Gain visibility into project profitability, resource utilisation and client performance, helping leadership focus on the work, customers and services that create the strongest returns.
SaaS & Subscription Businesses
Track acquisition, retention, customer health and usage trends in one place, making it easier to reduce churn, improve engagement and support sustainable growth.
Operations & Manufacturing
Bring production, supply chain and cost data together to uncover bottlenecks, reduce waste and improve operational efficiency through data-driven decision making.
What Data Intelligence Delivers
Data intelligence turns scattered information into clear visibility. When everyone works from the same trusted data, decisions become faster, more accurate and easier to act on.
Key Benefits
05- Decisions based on facts, not assumptions or outdated reports
- Live visibility that replaces manual reporting and spreadsheets
- A single source of truth across teams and systems
- Hidden opportunities, risks and profit drivers made visible
- Clear insight into customer behaviour and business performance
- The right information available when decisions need to be made
What This Looks Like in Practice
See how data intelligence transforms disconnected systems into a single source of truth, giving leaders the visibility and confidence to make better decisions every day.
The scenario
Consider a mid-sized business that sells through several channels and runs on a familiar tangle of tools: one system for online sales, another for in-person, separate accounting software, a support platform, and the inevitable spreadsheets. Each system has its own version of the truth, and pulling a complete picture together means someone spending a day a week exporting and reconciling, ending up with a report that is already out of date by the time it is finished.
The approach
With data intelligence in place, those systems feed one reconciled warehouse, and the dashboards update themselves. For the first time, the business can see true profitability by product and channel with all costs counted. A product line everyone was proud of turns out to barely break even once fulfilment is included. A customer segment the marketing budget was pouring into turns out to churn quickly, while a neglected segment is loyal and profitable. None of this was hidden by intent; it was simply scattered across systems where nobody could see it whole.
The result
The outcome is not a flashy prediction, it is clarity, and clarity changes decisions. Marketing spend shifts toward the segment that actually pays. The break-even product line gets repriced or rethought. The weekly day of manual reporting vanishes. That is the shape of data intelligence done well: it does not tell the future, it shows the present honestly, and an honest present is something most businesses have never actually had.
Frequently Asked Questions
Explore the most common questions about data intelligence and discover how better visibility, cleaner data and smarter reporting help businesses make more confident decisions.
Data intelligence shows you what is happening now, clearly, by bringing your data together and reporting on it. Machine learning predicts what will happen or classifies new cases. Data intelligence illuminates the present; machine learning looks to the future. Many businesses start with data intelligence to get a clear picture, then add machine learning to predict on top of it.
Yes, and that is the core of the work. We connect to your various systems, sales, finance, support, operations, and bring the data together into one reconciled, consistent picture. Most businesses have exactly this scattered-data problem, so pulling it together and resolving the inconsistencies between systems is a normal and central part of what we do.
That is the normal starting point, not a problem unique to you. Cleaning, reconciling and resolving inconsistencies is a major part of the work, and we take it seriously because intelligence built on messy data misleads rather than helps. We are upfront that this foundational step matters and build it into the project rather than papering over it with a nice-looking dashboard.
Yes. We build data pipelines that keep the underlying data current, so dashboards and reports reflect the live picture rather than a manual snapshot someone has to refresh. The whole point is to replace the tedious manual assembly of reports with views that are always up to date, so your team sees reality as it is now, not as it was last week.
Yes. Data intelligence works with your real, often sensitive business and customer data, so we build to GDPR and AVG, keep data in EU regions where required, and handle personal data carefully throughout. Our European base in Amstelveen means EU data protection is familiar ground, and protecting your data is built into how we run the project.
We design for the people who will use it, which usually means different views for different roles. An executive gets the headline picture at a glance; a manager gets the detail for their area; an analyst can dig in. Designing around real users rather than building one generic dashboard is what makes the difference between something adopted daily and something quietly ignored.
A focused dashboard on reasonably clean data can be delivered in a few weeks. Projects involving significant data cleaning across many systems, or a full BI setup, take a few months. We usually start with one high-value area, prove the value, and expand, so you get a useful picture quickly rather than waiting for a complete build before seeing anything.
Data pipelines need maintaining as your systems change, and reporting needs evolve as the business does, so we keep things current as part of ongoing support. A dashboard whose data feed quietly breaks becomes misleading fast. We make sure the picture stays accurate and useful over time rather than degrading into something nobody trusts.